Chart
Demonstrates the Chart widget.
git clone https://github.com/ratatui/ratatui.git --branch latestcd ratatuicargo run --example=chart --features=crossterm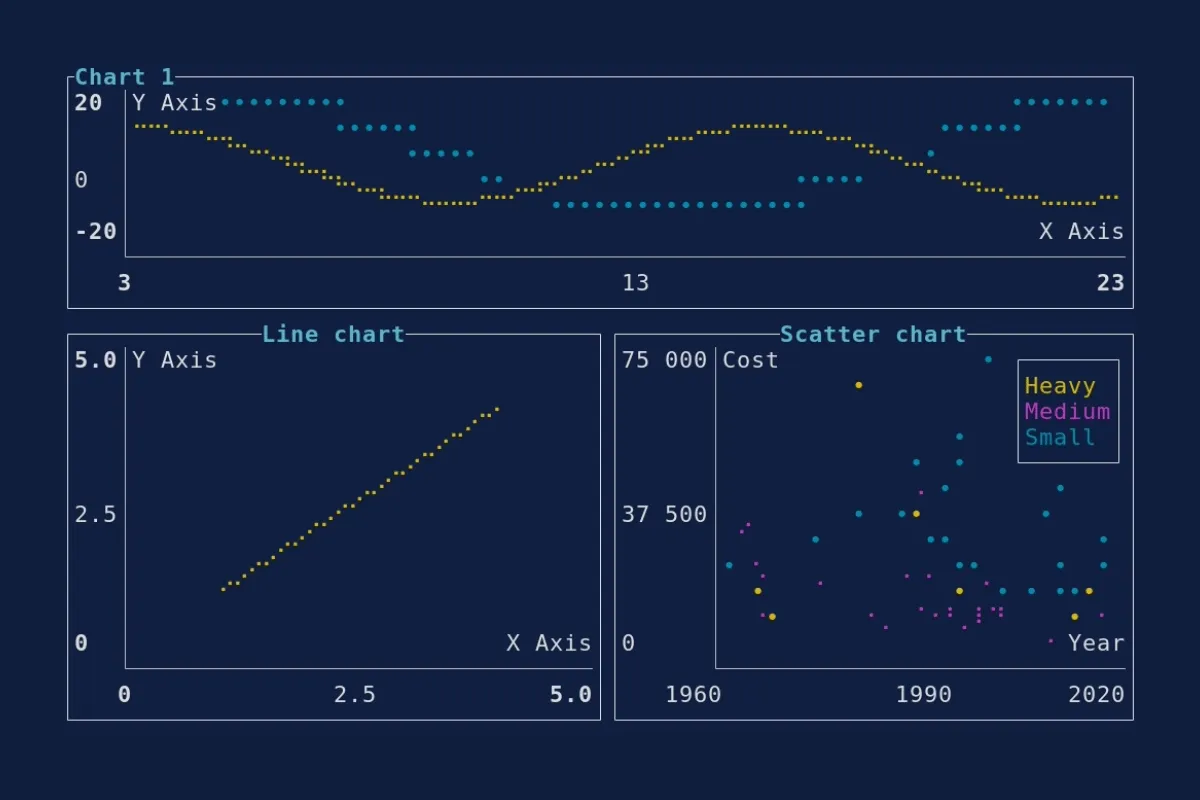
//! # [Ratatui] Chart example//!//! The latest version of this example is available in the [examples] folder in the repository.//!//! Please note that the examples are designed to be run against the `main` branch of the Github//! repository. This means that you may not be able to compile with the latest release version on//! crates.io, or the one that you have installed locally.//!//! See the [examples readme] for more information on finding examples that match the version of the//! library you are using.//!//! [Ratatui]: https://github.com/ratatui/ratatui//! [examples]: https://github.com/ratatui/ratatui/blob/main/examples//! [examples readme]: https://github.com/ratatui/ratatui/blob/main/examples/README.md
use std::time::{Duration, Instant};
use color_eyre::Result;use ratatui::{    crossterm::event::{self, Event, KeyCode},    layout::{Alignment, Constraint, Layout, Rect},    style::{Color, Modifier, Style, Stylize},    symbols::{self, Marker},    text::Span,    widgets::{block::Title, Axis, Block, Chart, Dataset, GraphType, LegendPosition},    DefaultTerminal, Frame,};
fn main() -> Result<()> {    color_eyre::install()?;    let terminal = ratatui::init();    let app_result = App::new().run(terminal);    ratatui::restore();    app_result}
struct App {    signal1: SinSignal,    data1: Vec<(f64, f64)>,    signal2: SinSignal,    data2: Vec<(f64, f64)>,    window: [f64; 2],}
#[derive(Clone)]struct SinSignal {    x: f64,    interval: f64,    period: f64,    scale: f64,}
impl SinSignal {    const fn new(interval: f64, period: f64, scale: f64) -> Self {        Self {            x: 0.0,            interval,            period,            scale,        }    }}
impl Iterator for SinSignal {    type Item = (f64, f64);    fn next(&mut self) -> Option<Self::Item> {        let point = (self.x, (self.x * 1.0 / self.period).sin() * self.scale);        self.x += self.interval;        Some(point)    }}
impl App {    fn new() -> Self {        let mut signal1 = SinSignal::new(0.2, 3.0, 18.0);        let mut signal2 = SinSignal::new(0.1, 2.0, 10.0);        let data1 = signal1.by_ref().take(200).collect::<Vec<(f64, f64)>>();        let data2 = signal2.by_ref().take(200).collect::<Vec<(f64, f64)>>();        Self {            signal1,            data1,            signal2,            data2,            window: [0.0, 20.0],        }    }
    fn run(mut self, mut terminal: DefaultTerminal) -> Result<()> {        let tick_rate = Duration::from_millis(250);        let mut last_tick = Instant::now();        loop {            terminal.draw(|frame| self.draw(frame))?;
            let timeout = tick_rate.saturating_sub(last_tick.elapsed());            if event::poll(timeout)? {                if let Event::Key(key) = event::read()? {                    if key.code == KeyCode::Char('q') {                        return Ok(());                    }                }            }            if last_tick.elapsed() >= tick_rate {                self.on_tick();                last_tick = Instant::now();            }        }    }
    fn on_tick(&mut self) {        self.data1.drain(0..5);        self.data1.extend(self.signal1.by_ref().take(5));
        self.data2.drain(0..10);        self.data2.extend(self.signal2.by_ref().take(10));
        self.window[0] += 1.0;        self.window[1] += 1.0;    }
    fn draw(&self, frame: &mut Frame) {        let [top, bottom] = Layout::vertical([Constraint::Fill(1); 2]).areas(frame.area());        let [animated_chart, bar_chart] =            Layout::horizontal([Constraint::Fill(1), Constraint::Length(29)]).areas(top);        let [line_chart, scatter] = Layout::horizontal([Constraint::Fill(1); 2]).areas(bottom);
        self.render_animated_chart(frame, animated_chart);        render_barchart(frame, bar_chart);        render_line_chart(frame, line_chart);        render_scatter(frame, scatter);    }
    fn render_animated_chart(&self, frame: &mut Frame, area: Rect) {        let x_labels = vec![            Span::styled(                format!("{}", self.window[0]),                Style::default().add_modifier(Modifier::BOLD),            ),            Span::raw(format!("{}", (self.window[0] + self.window[1]) / 2.0)),            Span::styled(                format!("{}", self.window[1]),                Style::default().add_modifier(Modifier::BOLD),            ),        ];        let datasets = vec![            Dataset::default()                .name("data2")                .marker(symbols::Marker::Dot)                .style(Style::default().fg(Color::Cyan))                .data(&self.data1),            Dataset::default()                .name("data3")                .marker(symbols::Marker::Braille)                .style(Style::default().fg(Color::Yellow))                .data(&self.data2),        ];
        let chart = Chart::new(datasets)            .block(Block::bordered())            .x_axis(                Axis::default()                    .title("X Axis")                    .style(Style::default().fg(Color::Gray))                    .labels(x_labels)                    .bounds(self.window),            )            .y_axis(                Axis::default()                    .title("Y Axis")                    .style(Style::default().fg(Color::Gray))                    .labels(["-20".bold(), "0".into(), "20".bold()])                    .bounds([-20.0, 20.0]),            );
        frame.render_widget(chart, area);    }}
fn render_barchart(frame: &mut Frame, bar_chart: Rect) {    let dataset = Dataset::default()        .marker(symbols::Marker::HalfBlock)        .style(Style::new().fg(Color::Blue))        .graph_type(GraphType::Bar)        // a bell curve        .data(&[            (0., 0.4),            (10., 2.9),            (20., 13.5),            (30., 41.1),            (40., 80.1),            (50., 100.0),            (60., 80.1),            (70., 41.1),            (80., 13.5),            (90., 2.9),            (100., 0.4),        ]);
    let chart = Chart::new(vec![dataset])        .block(            Block::bordered().title(                Title::default()                    .content("Bar chart".cyan().bold())                    .alignment(Alignment::Center),            ),        )        .x_axis(            Axis::default()                .style(Style::default().gray())                .bounds([0.0, 100.0])                .labels(["0".bold(), "50".into(), "100.0".bold()]),        )        .y_axis(            Axis::default()                .style(Style::default().gray())                .bounds([0.0, 100.0])                .labels(["0".bold(), "50".into(), "100.0".bold()]),        )        .hidden_legend_constraints((Constraint::Ratio(1, 2), Constraint::Ratio(1, 2)));
    frame.render_widget(chart, bar_chart);}
fn render_line_chart(frame: &mut Frame, area: Rect) {    let datasets = vec![Dataset::default()        .name("Line from only 2 points".italic())        .marker(symbols::Marker::Braille)        .style(Style::default().fg(Color::Yellow))        .graph_type(GraphType::Line)        .data(&[(1., 1.), (4., 4.)])];
    let chart = Chart::new(datasets)        .block(            Block::bordered().title(                Title::default()                    .content("Line chart".cyan().bold())                    .alignment(Alignment::Center),            ),        )        .x_axis(            Axis::default()                .title("X Axis")                .style(Style::default().gray())                .bounds([0.0, 5.0])                .labels(["0".bold(), "2.5".into(), "5.0".bold()]),        )        .y_axis(            Axis::default()                .title("Y Axis")                .style(Style::default().gray())                .bounds([0.0, 5.0])                .labels(["0".bold(), "2.5".into(), "5.0".bold()]),        )        .legend_position(Some(LegendPosition::TopLeft))        .hidden_legend_constraints((Constraint::Ratio(1, 2), Constraint::Ratio(1, 2)));
    frame.render_widget(chart, area);}
fn render_scatter(frame: &mut Frame, area: Rect) {    let datasets = vec![        Dataset::default()            .name("Heavy")            .marker(Marker::Dot)            .graph_type(GraphType::Scatter)            .style(Style::new().yellow())            .data(&HEAVY_PAYLOAD_DATA),        Dataset::default()            .name("Medium".underlined())            .marker(Marker::Braille)            .graph_type(GraphType::Scatter)            .style(Style::new().magenta())            .data(&MEDIUM_PAYLOAD_DATA),        Dataset::default()            .name("Small")            .marker(Marker::Dot)            .graph_type(GraphType::Scatter)            .style(Style::new().cyan())            .data(&SMALL_PAYLOAD_DATA),    ];
    let chart = Chart::new(datasets)        .block(            Block::bordered().title(                Title::default()                    .content("Scatter chart".cyan().bold())                    .alignment(Alignment::Center),            ),        )        .x_axis(            Axis::default()                .title("Year")                .bounds([1960., 2020.])                .style(Style::default().fg(Color::Gray))                .labels(["1960", "1990", "2020"]),        )        .y_axis(            Axis::default()                .title("Cost")                .bounds([0., 75000.])                .style(Style::default().fg(Color::Gray))                .labels(["0", "37 500", "75 000"]),        )        .hidden_legend_constraints((Constraint::Ratio(1, 2), Constraint::Ratio(1, 2)));
    frame.render_widget(chart, area);}
// Data from https://ourworldindata.org/space-exploration-satellitesconst HEAVY_PAYLOAD_DATA: [(f64, f64); 9] = [    (1965., 8200.),    (1967., 5400.),    (1981., 65400.),    (1989., 30800.),    (1997., 10200.),    (2004., 11600.),    (2014., 4500.),    (2016., 7900.),    (2018., 1500.),];
const MEDIUM_PAYLOAD_DATA: [(f64, f64); 29] = [    (1963., 29500.),    (1964., 30600.),    (1965., 177_900.),    (1965., 21000.),    (1966., 17900.),    (1966., 8400.),    (1975., 17500.),    (1982., 8300.),    (1985., 5100.),    (1988., 18300.),    (1990., 38800.),    (1990., 9900.),    (1991., 18700.),    (1992., 9100.),    (1994., 10500.),    (1994., 8500.),    (1994., 8700.),    (1997., 6200.),    (1999., 18000.),    (1999., 7600.),    (1999., 8900.),    (1999., 9600.),    (2000., 16000.),    (2001., 10000.),    (2002., 10400.),    (2002., 8100.),    (2010., 2600.),    (2013., 13600.),    (2017., 8000.),];
const SMALL_PAYLOAD_DATA: [(f64, f64); 23] = [    (1961., 118_500.),    (1962., 14900.),    (1975., 21400.),    (1980., 32800.),    (1988., 31100.),    (1990., 41100.),    (1993., 23600.),    (1994., 20600.),    (1994., 34600.),    (1996., 50600.),    (1997., 19200.),    (1997., 45800.),    (1998., 19100.),    (2000., 73100.),    (2003., 11200.),    (2008., 12600.),    (2010., 30500.),    (2012., 20000.),    (2013., 10600.),    (2013., 34500.),    (2015., 10600.),    (2018., 23100.),    (2019., 17300.),];